Why the drop-off matters more than the total
A conversion rate of 2% tells you that something leaks. It does not tell you where. Most of the loss is usually at one step: the pricing page, the sign-up form, or the checkout. Fix that one step and every channel converts better, with the same traffic.
Where twelvebit shows it
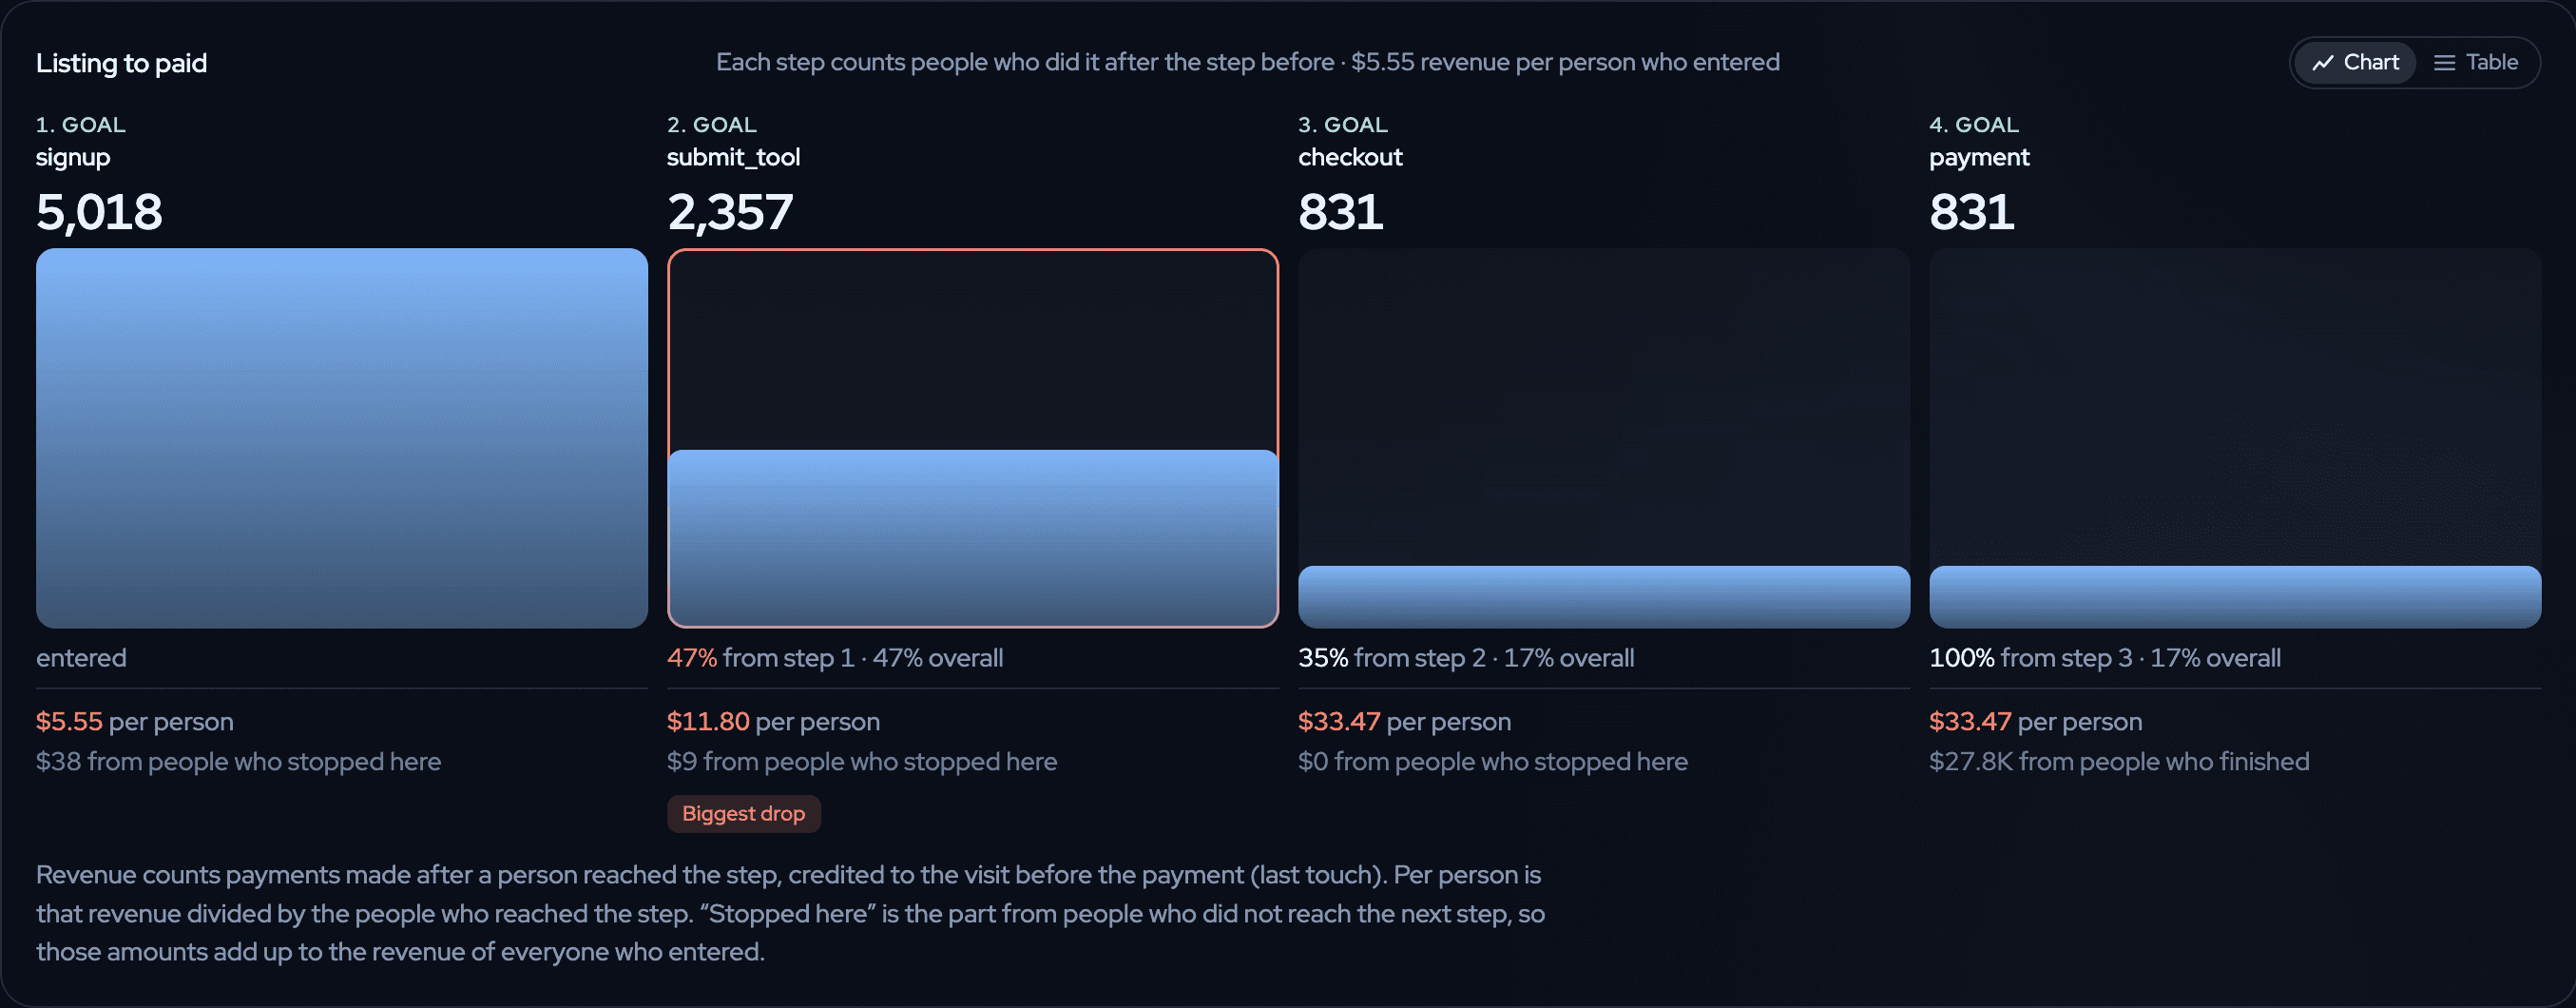
Open Funnels. The headline says it in one sentence: "1 in N people finish this funnel. The biggest drop is between A and B." Each step shows the people, the share from the step before and the share overall, as a chart or a table. The worst step is marked Biggest drop. With revenue connected, each step also shows the revenue per person who reached it, and the revenue from the people who stopped there.
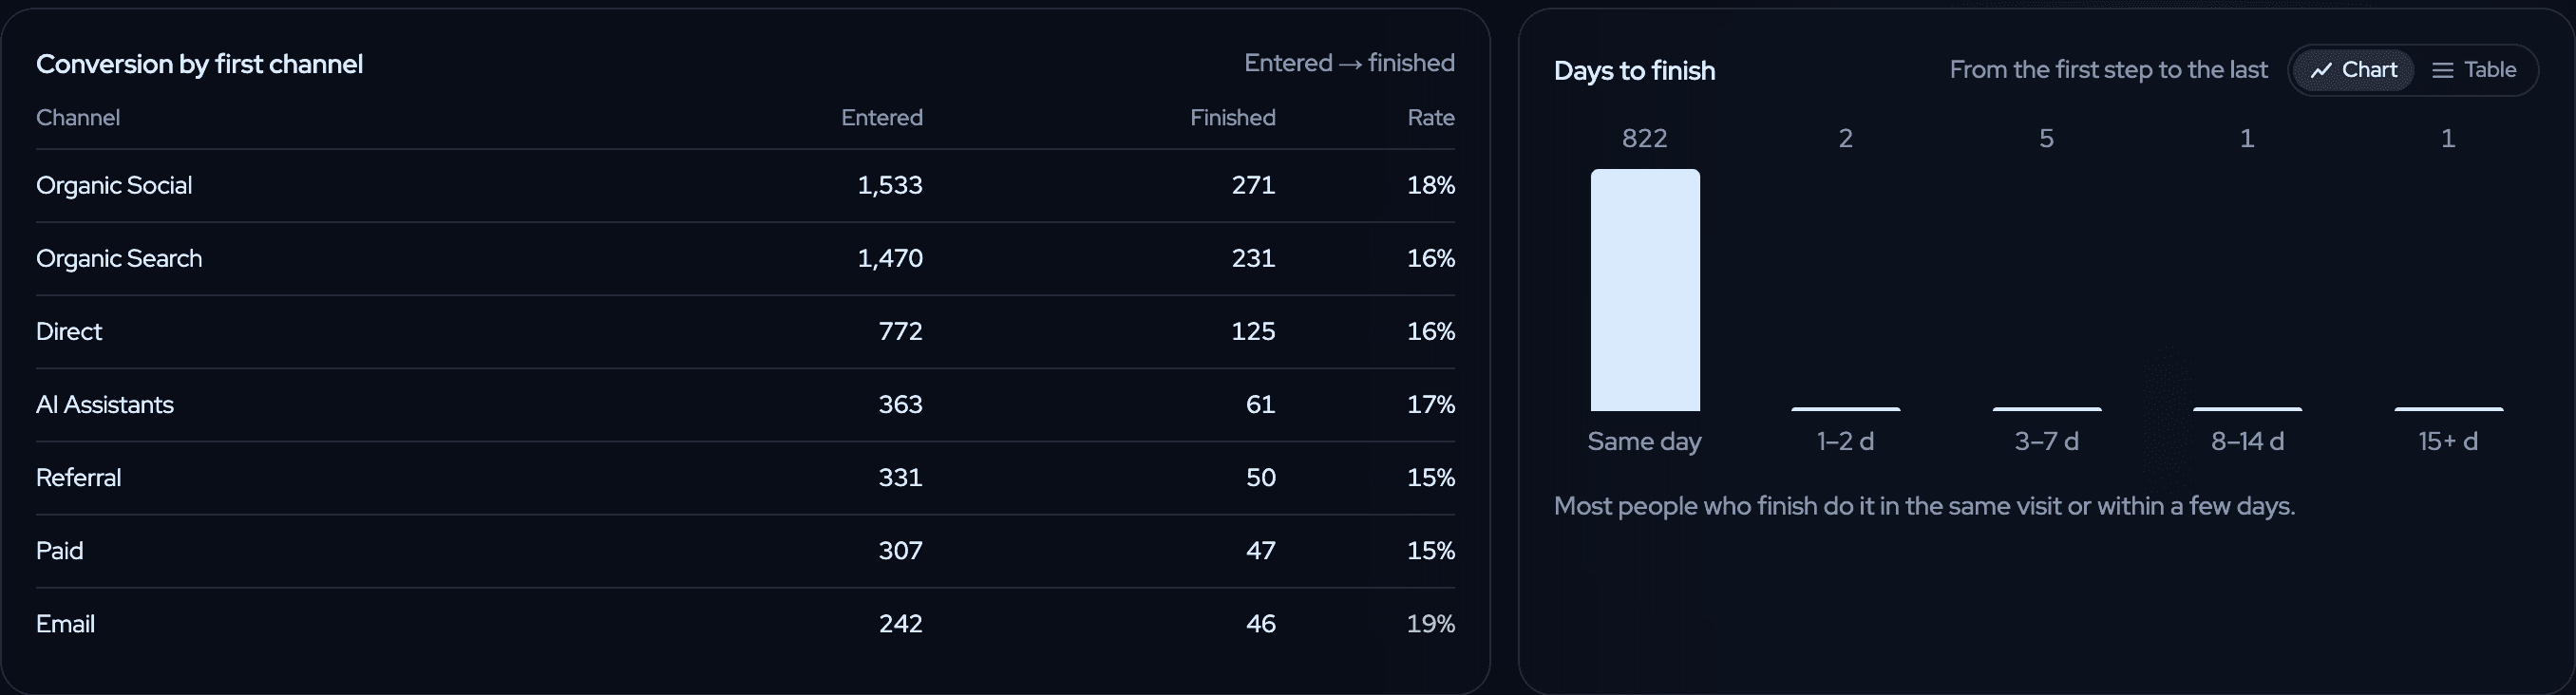
Below the table, Conversion by first channel shows which channels bring people who finish, and Days to finish shows how long they take. Each person counts once for each step, in order.
How to do it
- Track the steps that matter as goals, for example
signupandcheckout_started. A payment from your provider is a step too. - Open Funnels and click + New funnel. Each step is a page (is, contains or starts with) or a goal.
- Or write the funnel in
analytics.yaml, so your coding agent keeps it next to the code:page:/pricing,signup,payment. See the tracking plan docs. - No funnel yet? twelvebit suggests one, Visit to payment, from your pricing page and your sign-up, checkout and payment goals.